
1. Whole Life Cycle Perspective Outperforms Single-Point Cost Comparison
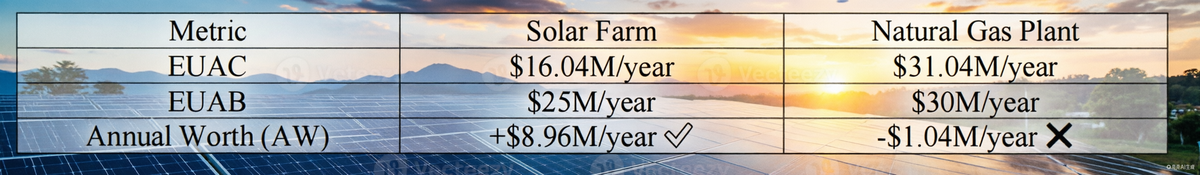
The solar farm's initial investment reaches $150 million, which is 1.875 times that of the natural gas plant ($80 million). If one only looks at upfront costs, decision-makers would lean toward the natural gas option. However, through Annual Worth Analysis, the solar scheme yields a net annual benefit of +$8.96 million/year, while the natural gas scheme shows -$1.04 million/year (a loss). This reveals: high initial costs are not scary — what is scary is high operating costs that continuously drain value.

2. Fuel Cost Is the "Fatal Flaw" of the Natural Gas Scheme
The natural gas plant incurs $8 million/year in fuel costs, accumulating to $160 million over 20 years — already exceeding its initial investment. Combined with O&M expenses, its Equivalent Uniform Annual Cost (EUAC) reaches $31.04 million/year, far surpassing its annual revenue of $30 million, guaranteeing a loss. In contrast, solar energy has zero fuel cost, which is the fundamental guarantee of its long-term economic viability.

3. Different-Life Alternatives Must Be Compared on a Unified Baseline
The solar farm has a 25-year lifespan, while the natural gas plant lasts 20 years. Direct comparison of total costs or total revenues would be distorted because the time horizons differ. The Annual Worth (AW) method converts all cash flows into an equivalent uniform annual amount, eliminating the impact of lifespan differences and enabling comparison on the same temporal dimension. This is the standard approach in engineering economics for evaluating mutually exclusive alternatives.
4. MARR (Minimum Acceptable Rate of Return) Is the "Watershed" of Decision-Making
This case adopts MARR = 8%, representing the minimum time-value-of-money requirement for the firm. If MARR were set too low, the disadvantage of high operating-cost schemes might be underestimated; if set too high, capital-intensive schemes might be excessively penalized. The 8% rate reflects the conservative risk appetite of a utility company.

5. Strategic Insight: From "Capital Expenditure Minimization" to "Total Cost of Ownership Minimization"
1· Short-term thinking: Choose natural gas, save $70 million in initial investment
2· Long-term thinking: Choose solar, accumulate $224 million in net benefits over 25 years ($8.96M × 25 years)
The natural gas scheme appears "cheap" but is actually trading short-term savings for long-term losses; the solar scheme appears "expensive" but is actually locking in long-term returns through upfront investment.
6. The Hidden Value of Environmental Externalities
Although the case does not quantify carbon emission costs, the zero-fuel nature of solar energy implies:
· No carbon tax risk
· No natural gas price volatility risk
· Alignment with ESG trends, facilitating access to green financing
These implicit advantages further reinforce the strategic value of solar energy.

7. The Power of Annual Worth Analysis in Engineering Economics
The Annual Worth method transforms complex, multi-year cash flows into a single, intuitive
annual figure. It answers the question every decision-maker needs to know: "How much does
this project earn or cost me every single year?"
One-Sentence Summary
The core wisdom of engineering economics: Don't ask "How much do I spend now?" — ask "How much do I earn every year?" Don't ask "Which is cheaper?" — ask "Which is more valuable?" Whole life-cycle cost analysis across the time dimension is the only path to transcend short-term temptations and make rational decisions.

Final Decision
Select the Solar Farm. It delivers positive annual worth ($8.96M/year), while the natural gas plant yields negative annual worth (-$1.04M/year). Higher initial investment with lower operating costs can be economically superior when analyzed over the complete life cycle.
Background Information
A utility company must choose between building a 100MW solar farm or a natural gas power plant. Both options have different cost structures, lifespans, and environmental impacts.
MARR = 8%


提供技术支持